Thursday, 2 May 2013

8~14 April (week 12)

-Project progress
-the development of the project and the output from the hardware and the software ... i have done with software of labVIew and must connect to the DAQ card to get the signal . 

Data acquisition is the process of sampling signals that measure real world physical conditions and converting the resulting samples into digital numeric values that can be manipulated by a computer. Data acquisition systems (abbreviated with the acronym DAS or DAQ) typically convert analog waveforms into digital values for processing. The components of data acquisition systems include:
  • Sensors that convert physical parameters to electrical signals.
  • Signal conditioning circuitry to convert sensor signals into a form that can be converted to digital values.
  • Analog-to-digital converters, which convert conditioned sensor signals to digital values.
Data acquisition applications are controlled by software programs developed using various general purpose programming languages such as BASIC, C .


-Now we already knew what is the DAQ card , need to test the real prop and connect it to the DAQ card through the laptop using the labview software .


Terminal Configuration specifies the grounding mode used for the virtual channel:
  • Differential—Depending on your specific hardware, the positive and negative inputs for the physical channel are either unreferenced or are connected to measurement system ground through equal impedances. Refer to your hardware documentation for more information. If your differential physical channel is unreferenced, you should provide a connection to measurement ground through an external bias resistor when measuring floating signal sources such as thermocouples or battery-powered devices. The differential terminal configuration measures the difference between the positive and negative inputs and provides good rejection of common-mode voltage and noise.
  • RSE—Measurement made with respect to ground.
  • NRSE—Measurement made with respect to AISENSE. 

-RSE (referenced signal enabled)  :Its start from normalize (1.5v) and its a stable signal  
-Differential: Is offset (100mV) almost zeroand its not stable at all .


-When we connect the DAQ card to the ground we got no change for the signal for either one , however , in this project i have used the subtraction X1-X2 to get the actual signal so , X1 is the first input and X2 is the second signal but i couldnt get it exactly but almost typical , here are some of the pictures from testing the prop ( fingertip ) to see whether the signal is there or not and record the data usng the write to file measurment for future needs :


-I have set the Terminal configuration to RSE and i have mentioned the reason why before , as we can see the amplitude of the signal is 1.406 exactly that one during testing using my finger pulse and by testing another person i have got this result :


-As we can see at the above signal that the amplitude is quite high , because PPG signal are many types , i will show some of the types a little bit about the types of the signal for PPG .

                                             figure 1 : the filtered ppg signal 


                                            Figure 2 : spectral for normal subject 

                                           
                                           Figure 3 : signal of atrial flutter patient 


                                                Figure 4 : signal for normal subject 


- With these results, it is certain thatthe PPG signal contains information about the cardiac
activity.


-. PRE-PROCESSING IN PPG SIGNALS
- The quality of the PPG signal depends on the location and the properties of the subject's skin at measurement, includingthe individual skin structure, the blood oxygen saturation,blood flow rate, skin temperatures and the measuring environment.These factors generate several types of additive artifact which may be contained within the PPG signals. This may affect the extraction of features and hence the overall diagnosis, especially, when the PPG signal and its derivatives will be assessed in an algorithmic fashion. 
The main challenge in processing the PPG signals are described as follows:

1) .Powerline Interference
 This artifact could be due to the instrumentation amplifi-ers, the recording system picking up ambient electromagnetic signals  and other artifact.  Moreover, high frequency artifact caused by mains
power sources interference is induced onto the PPG recording probeorcable.This artifact introduces sinusoidal component into the recording. In Australia this component is at a frequency of 50Hz.
The periodic interference is clearly displayed as a spike in Fig. at not only its fundamental frequency of 50 Hz, but also as spikes at 100 Hz and its higher harmonics. 


2) Motion Artifact
 This artifact is may be caused by poor contact to the fin- gertip photo sensor. Variations in temperature and bias in the instrumentation amplifiers can sometimes cause baseline drift as well.    In our measurements, the body movement was limited due to the short time of measurement (20 seconds) and the fixed position of the arm during the fingertip PPG signal collection. It is hard to arrange a procedure to measure PPG signal without low frequency artifact, Fig.  shows a noisy .


                              figure 5 : powerline and artifacts in ppg .


1~7 April 2013 (Week 11)

-Constructing of the circuit :

-This circuit use op-Amp by High Pass Filter and Low Pass Filter , i have already mentioned the differences between these tow types of filter in the last week , for this week progress i have already constructed the circuit and now is the time for testing the circuit whether its working or not , but so far the construction of the circuit is good , now will upload some of the photos as you can see below :


-After the circuit was well constructed now will try to test it using the oscilloscope to see the whether the signal is accurate or not and get the value of the peak-peak as you can see below the picture off the testing :


-From this testing i just could not  the reason why there is no signal at all because if there is no signal thats mean there is something wrong with construction of the circuit , i have already checked the continty of the circuit and everything was there ... offft why i cant get the signal .

-In this situation i need to recheck the input voltage :


-From the photos above i have got the signal already , yay! so happy , i got it after changing the IC into 07c .


-Now need to test the sensor itself with and see if can get the signal from the oscilloscope here some photos from the testing :


this signal by using the prop from the fingertip  , its the signal of the PPG but itss very small , 


-This prop i have made it by myself to test it because the real one i didn't want to use , anything might happen while testing so i got the idea of making a almost similar to the real one , so the signal above is from the prop that i have made and the signal is quite acceptable , that was for the testing apart only.


Monday, 29 April 2013

25 ~31 MARCH 2013 (WEEK 10)

HIGH PASS FILTER VS LOW PASS FILTER

Filtering describes the act of processing data in a way that applies different levels of attenuation to different frequencies within the data.

A high pass filter will apply minimal attenuation (. leave levels unchanged) for high frequencies, but applies maximum attenuation to low frequencies.
A low pass filter is the reverse - it will apply no attenuation to low frequencies by applies attenuation to high frequencies.
There are a number of different filtering algorithms that are used. The two simplest are probably the Finite Impulse Response filter (. FIR filter) and the Infinite Impulse Response filter (. IIR filter).
The FIR filter works by keeping a series of samples and multiplying each of those samples by a fixed coefficient (which is based on the position in the series). The results of each of these multiplications is accumulated and is the output for that sample. This is referred to as a Multiply-Accumulate - and in dedicated DSP hardware there is a specific MAC instruction for doing just this.
When the next sample is taken it's added to the start of the series, and the oldest sample in the series is removed, and the process repeated.
The behavior of the filter is fixed by the selection of the filter coefficients.
One of the simplest filters that is often provided by image processing software is the averaging filter. This can be implemented by an FIR filter by setting all of the filter coefficients to the same value.

-Phototansistor 
-Are designed specifically to take advantages of this fact .the most -common variant is an NPN bipolar transistor with an exposed base region.Here,Light striking the base replaces what would ordinarily be voltage applied to the base so, a phototransistor amplifies variation in the light strking it.Note that phototransistor may or might not have a base lead (if they do, the base lead allows you to bias the phototransistor light response .


Saturday, 20 April 2013

18~24 MARCH 2013 (Week 9)


Tittle of Activity

- Pulse Oximeter .
-Transimpedence  Amplifier.


Objectives

-To make sure to understand the concept of pulse oximeter and the Transimpedence as well .


Content/Procedure

-Pulse oximeter

-The first thing that you need to remember is that if you are going to simply use a premade oximeter and just read the voltages coming out of it .

-The main things you need to remember is that you are looking at two diffrent output voltages .One from a red led and another from an infrared LED.The basic principle of the whole thing is sort of like what you probably did as a kid , taking a flashlight, holding it yo your hand at night and seeing your bones.As you can see at the figure below the two different LEDs will have dufferent voltage levels depending upon the saturation of the hemoglobin with O2.


-For more information about the pulse oximetry you can check out wikipedia website as a reference .

For getting to the LabVIEW
-As you can see at the above figure we are actually looking at two voltages.That means you will simply need to have two separate analog channels measuring the voltages coming from the diffrent LEDs .The pulse will be easy to see because the voltages will be going up and down easily showing the systole and diastole of the heart . You should be able to plot one of the two lines on a waveform graph and see the heartbeat (but we should keep in mind that pulse oximetry is very sensitive to noise artifact).The oxygen Saturation is alittle more difficult to measure and may require some custom scaling. However, what the difference is and how exactly that relates to a percentage. if you get a percentage of less than about 90% then you may want to head straight to the nearest hospital or stop smoking .


Pulse oximetry is a particularly convenient noninvasive measurement method. Typically it utilizes a pair of small light-emitting diodes (LEDs) facing a photodiode through a translucent part of the patient's body, usually a fingertip . One LED is red, with wavelength of 660 nm, and the other is infrared, 905, 910, or 940 nm. Absorption at these wavelengths differs significantly between oxyhemoglobin and its deoxygenated form; therefore, the oxy/deoxyhemoglobin ratio can be calculated from the ratio of the absorption of the red and infrared light. The absorbance of oxyhemoglobin and deoxyhemoglobin is the same (isosbestic point) for the wavelengths of 590 and 805 nm; earlier equipment used these wavelengths for correction of hemoglobin concentration.
The monitored signal fluctuates in time with the heart beat because the arterial blood vessels expand and contract with each heartbeat. By examining only the varying part of the absorption spectrum (essentially, subtracting minimum absorption from peak absorption), a monitor can ignore other tissues or nail polish, (though black nail polish tends to distort readings). and discern only the absorption caused by arterial blood. Thus, detecting a pulse is essential to the operation of a pulse oximeter and it will not function if there is none .


Transimpedence  Amplifier.

-Most engineers know that to design a transimpedance amplifier circuit, they just need a large-enough resistor to convert the input current to a reasonable output voltage range. To stabilize this circuit, a large enough capacitor must be placed in parallel with the feedback resistor. This article will show how to calculate the value for the feedback capacitor to ensure that the design has the largest possible bandwidth, and will still be stable.

-Calculating the feedback factor for an op amp that is set up for current-to-voltage conversion may be a bit of a mystery to many engineers. By deriving the transfer function for a transimpedance amplifier and using a voltage amplifier op amp, the conversion will be easy to understand. Here we use the LMV793 op amp as an example for a transimpedance amplifier design. A basic transimpedance amplifier configuration is shown in Figure 1.


-The figure shows the complete transimpedance amplifier; only the power supply decoupling capacitors are not shown. In most cases, the selection of the photodiode will allow the designer to use the same supply for VBIAS and +V. Using split supplies keeps the inverting input of the op amp at virtual ground. To derive the feedback factor, it is necessary to examine the equivalent circuit of the photodiode, Figure 2 :


-The diode is an ideal diode in the equivalent circuit. Since the photodiode must be back-biased for proper operation, the ideal diode is not included in the feedback factor calculations. CJ is the capacitance that occurs from the depletion region of the diode and it is included in the photodiode specifications. IPH is the current that occurs from the photodiode action. The impedance of the current source is the series resistance of the photo diode, shown as RSH. The series resistance is at least 10MΩ and typically much higher, usually over 100MΩ.


-The feedback factor is simply what is fed back to the input from the output of the op amp. This is calculated by assuming that the node at the input to the op amp is not connected to the input of the op amp, then calculating the ratio of the input voltage to the output voltage, VIN/VOUT. Figure below shows the circuit used to calculate the feedback factor.


Sunday, 14 April 2013

11 ~ 17 March 2013 (week 8)


Tittle of Activity :

Project Progress 
-Modifying the Appearance of graphs.
- Analyzing the Amplitude of the Signal .
-Controlling the Speed of Execution.
-adding a warning light.
-setting a Warning level limit.
-Warning the User.
-saving data to file.


Objectives

-Learn how to modify the Appearance of graphs .
-The way of analyzing the amplitude of the signal, and control.
-How to add a warning light and set it a level limit for that light .
-To warn the user and save the data to file .


Content/Procedure

-Modifying the Appearance of Graphs

-You can use the Display Format page of the Graph Properties dialog boxto specify how the scales of the x-axis and y-axis appear on the graph.Complete the following steps to change the format of the x-axis and y-axisof the Unfiltered Signal and Filtered Signal graphs.

1. In the front panel window, right-click the Unfiltered Signal graphindicator and select Properties from the shortcut menu. The GraphProperties dialog box appears.

2. On the Display Format page, select Time (X-Axis) from the toppull-down menu.

3. Select the Default editing mode option.

4. In the Type list, select Automatic formatting.

5. In the Digits field, enter 6 and select Significant digits from the Precision Type pull-down menu.

6. Place a checkmark in the Hide trailing zeros checkbox.

7. Select Amplitude (Y-Axis) from the top pull-down menu and repeat steps 3–6 so the y-axis configuration matches the x-axis configuration.

8. On the Scales page, select Amplitude (Y-Axis).

9. Remove the check mark from the Auto scale check box.

10. Enter -2.5 in the Minimum text box and 2.5 in the Maximum text box.

11. Click the OK button to save the configuration and close the Graph Properties dialog box.

12. Repeat steps 1–11 to configure the Filtered Signal graph indicator. The x-axis and the y-axis on the Unfiltered Signal and Filtered Signal graph indicators change to reflect the new configuration.


-Analyzing the Amplitude of a Signal

-You can use the Amplitude and Level Measurements Express VI to analyze the voltage characteristics of a signal. Complete the following steps to reconfigure the Express VI to measure the peak-to-peak amplitude values of the signal.

1. On the block diagram, double-click the Amplitude and Level Measurements Express VI to display the Configure Amplitude and Level Measurements dialog box.

2. In the Amplitude Measurements section, remove the checkmark from the RMS checkbox.

3. Place a check mark in the Peak to peak check box. Peak to peak appears in the Results section with the corresponding value of the measurement.

4. Click the OK button to save the current configuration and close the Configure Amplitude and Level Measurements dialog box. The RMS output of the Amplitude and Level Measurements Express VI changes to reflect the new Peak to Peak output, shown at left. You will use the Peak to Peak output in a later exercise.


 - Controlling the Speed of Execution

-To plot the points on the waveform graphs more slowly, you can add a time delay to the block diagram. A time delay slows the speed at which a VI runs. Complete the following steps to control the speed at which the VI runs.

1. On the block diagram, search for the Time Delay Express VI.

2. Place the Time Delay Express VI inside the While Loop. The Configure Time Delay dialog box appears.

3. Enter 1.000 in the Time delay (seconds) text box and click the OK button


4. Display the front panel and run the VI. The VI runs more slowly. The loop iterates once every second.

5. Stop the VI. Another way to control the speed of the VI is to alter the rate of data acquisition. On the block diagram, double click the Simulate Signal Express VI to display the Configure Simulate Signal dialog box. Locate the Timing section in the dialog box. The Timing section contains a number of ways to alter the rate of data acquisition and the speed at which a VI runs.
For example, one of the default settings of the VI is Simulate Acquisition Timing. This means that the VI mimics the acquisition rate of a hardware device. You can select Run as fast as possible to
display data more quickly. In the Samples per second (Hz) text box, the default value is 1000, while the default value in the Number of Samples text box is 100. This means that the VI will output 100 data
points spanning 0.1 second. You can change these values to change the amount of data the VI displays, as well as the rate at which the VI displays the data.

-Adding a Warning Light

-If you want a visual cue to indicate when a value exceeds a specified limit, you can use a warning light.
Complete the following steps to add a warning light to the VI.

1. Display the Controls palette by right-clicking any blank space in the front panel window.

2. On the Express palette, select the LEDs palette.

3. Select the round LED indicator and add it to the front panel to the left of the waveform graphs.

4. Double-click the Boolean label above the LED and enter Warning to change the label of the LED.
You will use this LED in a later exercise to indicate when a value has exceeded its limit.

5. Select File»Save As to display the Save As dialog box.

6. Read the various dialog box options. Select the Copy and Substitute copy for original options to create a copy of the original VI and immediately edit the copy.

7. Click the Continue button and save the VI as Warning Light.vi in an easily accessible location.

-Setting a Warning Level Limit

-To specify the value at which you want the LED to light, use the Comparison Express VI. Complete the following steps to compare the peak-to-peak value to a limit you set.

1. On the block diagram, search for the Comparison Express VI and place it to the right of the Amplitude and Level Measurements Express VI. The Configure Comparison dialog box appears.

2. In the Compare Condition section, select the > Greater option.

3. In the Comparison Inputs section, select Value and enter 2 in the Value numeric control to assign a constant value at which you want the LED to light.

4. Click the OK button to save the current configuration and close the Configure Comparison dialog box. The name of the Comparison Express VI changes to reflect the operation of the Express VI, shown at left. Greater indicates that the Express VI does a greater than comparison.

5. Wire the Peak to Peak output of the Amplitude and Level Measurements Express VI to the Operand 1 input of the Greater Express VI.

6. Move the cursor over the wire that connects the Peak to Peak output to the Operand 1 input.

7. When the Positioning tool appears, right-click the wire that connects the Peak to Peak output to the Operand 1 input and select Create» Numeric Indicator from the shortcut menu. A Peak to Peak terminal, shown at left, appears on the block diagram. If the Peak to Peak terminal appears to be on top of the wires between the Express VIs, move the Express VIs and Peak to Peak terminal
around to create more space. For example, move the Peak to Peak terminal into blank space above the Express VIs.


-Warning the User

After you specify the values at which you want the LED to light, you must wire the LED to the Greater Express VI. Complete the following steps to provide a visual cue when the peak-to-peak value of the signal exceeds a specified limit.

1. In the block diagram window, move the Warning terminal to the right of the Greater Express VI. Make sure the Warning terminal is inside the While Loop, as shown in Figure below :


2. Wire the Result output of the Greater Express VI to the Warning terminal. The block diagram should appear similar to Figure above .

3. Display the front panel. A numeric indicator labeled Peak to Peak appears in the front panel
window. This indicator displays the peak-to-peak value of the signal.

4. Run the VI. When the peak-to-peak value exceeds 2.0, the Warning indicator lights.

5. Click the STOP button to stop the VI.

6. Save the VI.


                               figure1 :Block Diagram of the Save Data VI.


Result&Analysis 

-From this exercise we have learned how to modify the appearance of the graphs and analysis the amplitude of signal as well .
-Get the way of controlling the speed of execution and adding a warning light , as we know there are a limits for the warning light so in this exercise it teach you of setting warning light.
as well as warning the user and get the way of saving data for the signal .


Friday, 12 April 2013

4~10 March 2013 (week 7 )


Tittle Of Activity : 

Project Progress 
-Building an analysis VI .
-Modifying a VI Created from a template .
-Adding a Signal.
-Adding two Signal.
-Filtering a signal.\


Objectives:

-Learn how to build an analysis VI.
-The way of modifying a VI Created from a template .
-Learn how to filter a signal .


Content/Procedure

-In the following exercises, you will build a VI that generates a signal, filters
the signal, indicates if the signal exceeds a certain limit, and records the
data. After you complete the exercises, the front panel of the VI will look
similar to the front panel in Figure below :


Modifying a VI Created from a Template
Complete the following steps to create a VI that generates, analyzes, and
displays a signal.
1. In the Getting Started window, click New to display the New dialogbox.

2. From the Create New list, select VI»From Template»Tutorial (Getting Started)»Generate, Analyze, and Display. This templateVI simulates a signal and analyzes it for its root mean square (RMS

3. Click the OK button or double-click the name of the template to create a VI from the template.

4. If the Context Help window is not visible, press the <Ctrl-H> keys to display the window. (Mac OS X) Press the <Command-Shift-H> keys.

5. Display the block diagram by pressing the <Ctrl-E> keys.

6. Move the cursor over the Amplitude and Level Measurements Express VI, shown at left. The Context Help window displays information about the behavior of the Express VI. Keep the Context Help window open. It will provide useful information as you complete the rest of this exercise.
7. Display the front panel and remove the RMS indicator, shown at left. You will not use the RMS functionality of the Amplitude and Level Measurements Express VI for this exercise. However, you can use the Generate, Analyze, and Display template VI with the RMS functionality in the future to reduce development time.
8. Display the block diagram and remove any broken wires that result from removing the RMS indicator. To remove all broken wires from the block diagram, you can press the <Ctrl-B> keys.
9. Then return to the front panel window and right-click the waveform graph indicator. Select Properties from the shortcut menu. The Graph Properties dialog box appears.
10. On the Appearance page, place a checkmark in the Visible checkbox in the Label section and enter Unfiltered Signal in the text box.
11. Click the OK button to save the configuration and close the Graph Properties dialog box.
12. Run the VI.The signal appears in the graph.

13. Click the STOP button to stop the VI.


Adding a Signal

The Simulate Signal Express VI simulates a sine wave by default. You can customize the simulated signal by changing the options in the Configure Simulate Signal dialog box. Complete the following steps to create an additional simulated signal that adds uniform white noise to the sine wave.

1. On the block diagram, use the Positioning tool to select the Simulate Signal Express VI.
Hold down the <Ctrl> key and click and drag to create an additional Simulate Signal Express VI on the block diagram. (Mac OS X) Hold down the <Option> key and drag. (Linux) You also can hold down the middle mouse button and drag.

2. Release the mouse button to place the copied Simulate Signal Express VI below the original Simulate Signal Express VI. LabVIEW updates the name of the copied Simulate Signal Express VI to Simulate Signal2.

3. Double-click the Simulate Signal2 Express VI to display the Configure Simulate Signal dialog box.

4. Select Sine from the Signal type pull-down menu.

5. Enter 60 in the Frequency (Hz) text box.

6. Enter 0.1 in the Amplitude text box.

7. Place a checkmark in the Add noise checkbox to add noise to the sine signal.

8. Select Uniform White Noise from the Noise type pull-down menu.

9. Enter 0.1 in the Noise amplitude text box.

10. Enter -1 in the Seed number text box.

11. In the Timing section, select the Run as fast as possible option.

12. In the Signal Name section, remove the check mark from the Use signal type name check box.

13. Enter 60 Hz and Noise in the Signal name text box.When you change the signal name in the Configure Simulate Signaldialog box, LabVIEW changes the name of the signal output on the
block diagram. Changing the signal name makes it easier for you to identify the signal type when you view the Express VI on the block iagram .


-The Result Preview section displays a random signal. The Configure Simulate Signal dialog box should appear similar to Figure below :


14. Click the OK button to save the current configuration and close the Configure Simulate Signal dialog box.


Adding Two Signals

-To add two signals together to create one signal, you can use the Formula VI. Rather than merging two signals on one graph, the Formula Express VI adds both signals together to create a single signal on the graph. You can use this Express VI to add noise to a signal.


-Complete the following steps to add the 60 Hz and Noise signal to the Sine signal.

1. In the block diagram window, triple-click the wire that connects theSine output of the Simulate Signal Express VI to the Signals input ofthe Amplitude and Level Measurements Express VI and to the Unfiltered Signal indicator. Remove the wire.

2. On the Functions palette, click the Search button to search for the Formula Express VI, shown at left, and add it to the block diagram between the Simulate Signal Express VIs and the Amplitude and Level Measurements Express VI. The Configure Formula dialog box
appears. Note LabVIEW displays a folder glyph to the left of sub palettes in the search results and displays a light blue glyph to the left of Express VIs in the search results.

3. In the Label column, change the label for X1 to Sine and the label for X2 to 60 Hz and Noise.
The Formula Express VI automatically enters the first input, Sine, in the Formula text box.

4. Click the + button and then the X2 button to add Sine and 60 Hz and Noise together in the Formula text box.

5. Click the OK button to save the current configuration and close the Configure Formula dialog box.

6. Use the Wiring tool to wire the Sine output of the Simulate Signal Express VI to the Sine input of the Formula Express VI.
7. Wire the 60 Hz and Noise output of the Simulate Signal2 Express VI to the 60 Hz and Noise input of the Formula Express VI.
\
8. Wire the Result output of the Formula Express VI to the Unfiltered Signal indicator and to the Signals input of the Amplitude and Level Measurements Express VI.

9. Display the front panel by pressing the <Ctrl-E> keys.

10. Run the VI. The signal with added noise appears in the graph.

11. Click the STOP button to stop the VI.
12. Select File»Save As and save the VI as Analysis.vi in an easily accessible location.


Filtering a Signal

-You can use the Filter Express VI to process signals through filters and windows. Complete the following steps to configure the Filter Express VI to filter the signal using an infinite impulse response (IIR) filter.

1. Display the block diagram window and remove the wire that connects the Result output of the Formula Express VI to the Signals input of the Amplitude and Level Measurements Express VI.

2. Remove all broken wires that result from removing the wire.

3. Search for the Filter Express VI, shown at left, and add it to the block\ diagram between the Simulate Signal2 Express VI and the Amplitude and Level Measurements Express VI. The Configure Filter dialog box appears.

4. In the Filter Specifications section, change the Cutoff Frequency (Hz) to 25.

5. Click the OK button to save the configuration and close the Configure Filter dialog box.

6. Display the front panel.
7. Click the Unfiltered Signal waveform graph indicator and press the\ <Ctrl> key while you drag with the Positioning tool to create an additional waveform graph indicator.

8. Triple-click the Unfiltered Signal 2 label above the new waveform graph indicator and enter Filtered Signal to change the label of the indicator. You also can change the label on the Appearance page of the Graph Properties dialog box.

9. On the block diagram, wire the Result output of the Formula Express VI to the Signal input of the Filter Express VI and to the Unfiltered Signal waveform graph indicator.

10. Wire the Filtered Signal output of the Filter Express VI to the Signals input of the Amplitude and Level Measurements Express VI and to the input of the Filtered Signal waveform graph indicator.


Result&Analysis 

-From the exercise above ,we have learned how to build an analysis vi and at the same time how to add a signal and adding two signal as well . Therefore, Using the filter to filter the signal using an infinite impulse response (IIR) filter .


Friday, 22 March 2013

18~24 February 2013 (week 5 )

Title Of Activity 

-Project Progress :
 -Saving a data .
-Adding a Button That stores data when clicked .

Objectives

-To store information about the data a VI generates.
-Click the button to store the data.
-Run the program and see the storing information of the progress.


Content/Procedure

-To store information about the data a VI generates, use the Write To Measurement File Express VI.

-Complete the following steps to build a VI that saves peak-to-peak values and other information to a LabVIEW data file.

1. Search for the Write To Measurement File Express VI and add it to the block diagram below and to the right of the Amplitude and Level Measurements Express VI.

The Configure Write To Measurement File dialog box appears.The Filename text box displays the full path to the output file,test.lvm. A .lvm file is a tab-delimited text measurement file you
can open with a spreadsheet application or a text-editing application.LabVIEW saves data with up to six digits of precision in a .lvm file. LabVIEW saves the .lvm file in the default LabVIEW Data
directory. LabVIEW installs the LabVIEW Data directory in thedefault file directory of the operating system.When you want to view the data, use the file path displayed in the Filename text box to access the test.lvm file.


2. In the Configure Write to Measurement File dialog box, locate theIf a file already exists section and select the Append to file option to write all the data to the test.lvm file without erasing any existing
data in the file.


3. In the Segment Headers section, select the One header only optionto create only one header in the file to which LabVIEW writes the data.

4. Enter the following text in the File Description text box: Sample of peak to peak values. LabVIEW appends the text you enter in this text box to the header of the file.

5. Click the OK button to save the current configuration and close the Configure Write To Measurement File dialog box.


-Saving Data To A File 

-When you run the VI, LabVIEW saves the data to the test.lvm file. Complete the following steps to generate the test.lvm file:

1. On the block diagram, wire the Peak to Peak output of the Amplitude and Level Measurements Express VI to the Signals input of the Write To Measurement File Express VI.

2. Select File»Save As and save the VI as Save Data.vi in an easily accessible location.

3. Display the front panel and run the VI.

4. Click the front panel STOP button.

5. To view the data you saved, open the test.lvm file in the LabVIEW Data directory with a spreadsheet or text-editing application. 
The file has a header that contains information about the Express VI.

6. Close the file after you finish looking at it and return to the Save Data VI.


-Adding a Button That Stores Data When Clicked

-If you want to store only certain data points, you can configure the Write To Measurement File Express VI to save peak-to-peak values only when a user clicks a button.

Complete the following steps to add a button to the VI and configure how the button responds when a user clicks it.


1. Display the front panel and search the Controls palette for a rocker button. Select one of the rocker buttons and place it to the right of the waveform graphs.

2. Right-click the rocker button and select Properties from the shortcut menu to display the Boolean Properties dialog box.
3. Change the label of the button to Write to File.

4. On the Operation page of the Boolean Properties dialog box, select Latch when pressed from the Button behavior list.

Use the Operation page to specify how a button behaves when a user clicks it. To see how the button reacts to a click, click the button in the Preview Selected Behavior section.

5. Click the OK button to save the current configuration and close
the Boolean Properties dialog box.

6. Save the VI.


-Viewing Saved Data

-Complete the following steps to view the data that you save to the Selected Samples.lvm file.

1. Display the front panel and run the VI. Click the Write to File button several times.

2. Click the STOP button.

3. Open the Selected Samples.lvm file with a spreadsheet or text-editing application. The Selected Samples.lvm file differs from the test.lvm file. test.lvm recorded all the data generated by the Save Data VI, whereas Selected Samples.lvm recorded data only when you
clicked the Write to File button.

4. Close the file after you finish looking at it.

5. Save and close the VI.


                           Figure 1 : block diagram of save data .


                            Figure 2 : front panel of save data .


                            Figure 3 : context help box of Write To Measurement File .


Result&Analysis 

-The write to measurement file express VI saves data A VI generates and analysis to a .1vm, tdm, or , tdms measurement file .
- Get to know how to save the data and view it as well after the storing operation is completed .


25 February~3 March 2013 (week 6 )

Title Of Activity

-Project Progress 
  -Modifying a signal .
  -Customizing a user interface from the block diagram .
  -Controlling the speed of execution.
  -Using a table to display the data .
  -Using the cursor to get the exact value that we want .


Objectives

-Learn how to build the block diagram to modifies the signal .
-To customize a user interface from the block diagram .
-To control the speed of execution.


Content/Procedure

-Customizing a user interface from the block diagram :

-In the previous exercises, you added controls and indicators to the front panel using the Controls palette. You also can create controls and indicators from the block diagram.

-Complete the following steps to create controls and indicators from the
block diagram.

1. On the block diagram, right-click the Mean output of the Sample Compression Express VI and select Create»Numeric Indicator from the shortcut menu to create a numeric indicator. A Mean indicator,
shown at left, appears on the block diagram.

2. Right-click the Mean output of the Sample Compression Express VI and select Insert Input/Output from the shortcut menu to insert the Enable input.  In previous exercises, you learned to add inputs and outputs by expanding the Express VI using the down arrows. Using the shortcut menu is a different way to display and select the inputs and outputs of an Express VI.

3. Right-click the Enable input and select Create»Control from the shortcut menu to create a switch. A Boolean control, shown at left, appears on the block diagram.  Control terminals have a thicker border than indicator terminals. Also, an arrow appears on the right of the terminal if the terminal is a control,
and an arrow appears on the left of the terminal if the terminal is an indicator.

4. Right-click the wire that connects the Sine output of the Simulate Signal Express VI to the Signals input of the Sample Compression Express VI and select Create»Graph Indicator from the shortcut
menu.

5. Use the Wiring tool to wire the Mean output of the Sample
Compression Express VI to the Sine graph indicator. 

The Merge Signals function appears.

-Controlling the speed of execution:

-To plot the points on the waveform graph more slowly, you can add a time delay to the block diagram.

-Complete the following steps to control the speed at which the VI runs:

1. On the block diagram, search for the Time Delay Express VI, shown at  left, on the Functions palette and place it inside the While Loop. You can use the Time Delay Express VI to control the execution rate  of the VI.

2. Enter 0.25 in the Time delay (seconds) text box.  This time delay specifies how fast the loop runs. With a 0.25 second time delay, the loop iterates once every quarter of a second.

3. Click the OK button to save the current configuration and close the Configure Time Delay dialog box.

4. Display the front panel and run the VI.

5. Click the Enable switch and examine the change on the graph. If the Enable switch is on, the graph displays the reduced signal. If the Enable switch is off, the graph does not display the reduced signal.

6. Click the STOP button to stop the VI.


-Using a table to display the data :.

-Complete the following steps to display a collection of mean values in a front panel table :

1. Display the front panel.

2. On the Controls palette search for the Express Table indicator and  add it to the right of the waveform graph.

3. Display the block diagram. LabVIEW wired the Table terminal to the Build Table Express VI.

4. If the Build Table Express VI and the Table terminal are not selected already, click an open area on the block diagram to the left of the Build Table Express VI and the Table terminal. Drag the cursor diagonally until the selection rectangle encloses the Build Table Express VI and the Table terminal, shown at left.  A moving dashed outline, called a marquee, highlights the Build Table Express VI, the Table terminal, and the wire joining the two.


                           Figure 1 : Block diagram of modifying a signal an controlling the speed of execution.


                             Figure 2 :Front panel modifying a signal an controlling the speed of execution.


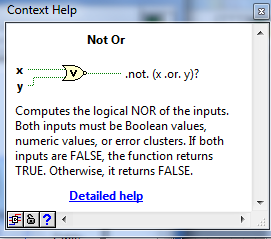
-In this progress i have used the not or gate as its described in figure 3 :


Result&Analysis 

-In this progress i have used the decoration to decorate the front panel to give a nice background of the  front panel , if you are willing to do the same , here is the step :

1-From the front panel go to the view , then select tools palette to control the coloring and so on .
2-From the function palette go to modern then select decoration, from there got many choices of choosing the shape that we want to use such as : thick lower box or lowered rounded box , flat circle , raised circle , ETC. 

-Therefore, the using of not or gate computes the logical nor of the inputs as we can see at the signal once we run it .