25 February~3 March 2013 (week 6 )
Title Of Activity
-Project Progress
-Modifying a signal .
-Customizing a user interface from the block diagram .
-Controlling the speed of execution.
-Using a table to display the data .
-Using the cursor to get the exact value that we want .
Objectives
-Learn how to build the block diagram to modifies the signal .
-To customize a user interface from the block diagram .
-To control the speed of execution.
Content/Procedure
-Customizing a user interface from the block diagram :
-In the previous exercises, you added controls and indicators to the front panel using the Controls palette. You also can create controls and indicators from the block diagram.
-Complete the following steps to create controls and indicators from the
block diagram.
1. On the block diagram, right-click the Mean output of the Sample Compression Express VI and select Create»Numeric Indicator from the shortcut menu to create a numeric indicator. A Mean indicator,
shown at left, appears on the block diagram.
2. Right-click the Mean output of the Sample Compression Express VI and select Insert Input/Output from the shortcut menu to insert the Enable input. In previous exercises, you learned to add inputs and outputs by expanding the Express VI using the down arrows. Using the shortcut menu is a different way to display and select the inputs and outputs of an Express VI.
3. Right-click the Enable input and select Create»Control from the shortcut menu to create a switch. A Boolean control, shown at left, appears on the block diagram. Control terminals have a thicker border than indicator terminals. Also, an arrow appears on the right of the terminal if the terminal is a control,
and an arrow appears on the left of the terminal if the terminal is an indicator.
4. Right-click the wire that connects the Sine output of the Simulate Signal Express VI to the Signals input of the Sample Compression Express VI and select Create»Graph Indicator from the shortcut
menu.
5. Use the Wiring tool to wire the Mean output of the Sample
Compression Express VI to the Sine graph indicator.
The Merge Signals function appears.
-Controlling the speed of execution:
-To plot the points on the waveform graph more slowly, you can add a time delay to the block diagram.
-Complete the following steps to control the speed at which the VI runs:
1. On the block diagram, search for the Time Delay Express VI, shown at left, on the Functions palette and place it inside the While Loop. You can use the Time Delay Express VI to control the execution rate of the VI.
2. Enter 0.25 in the Time delay (seconds) text box. This time delay specifies how fast the loop runs. With a 0.25 second time delay, the loop iterates once every quarter of a second.
3. Click the OK button to save the current configuration and close the Configure Time Delay dialog box.
4. Display the front panel and run the VI.
5. Click the Enable switch and examine the change on the graph. If the Enable switch is on, the graph displays the reduced signal. If the Enable switch is off, the graph does not display the reduced signal.
6. Click the STOP button to stop the VI.
-Using a table to display the data :.
-Complete the following steps to display a collection of mean values in a front panel table :
1. Display the front panel.
2. On the Controls palette search for the Express Table indicator and add it to the right of the waveform graph.
3. Display the block diagram. LabVIEW wired the Table terminal to the Build Table Express VI.
4. If the Build Table Express VI and the Table terminal are not selected already, click an open area on the block diagram to the left of the Build Table Express VI and the Table terminal. Drag the cursor diagonally until the selection rectangle encloses the Build Table Express VI and the Table terminal, shown at left. A moving dashed outline, called a marquee, highlights the Build Table Express VI, the Table terminal, and the wire joining the two.

Figure 1 : Block diagram of modifying a signal an controlling the speed of execution.

Figure 2 :Front panel modifying a signal an controlling the speed of execution.
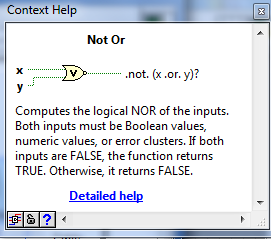
-In this progress i have used the not or gate as its described in figure 3 :
Result&Analysis
-In this progress i have used the decoration to decorate the front panel to give a nice background of the front panel , if you are willing to do the same , here is the step :
1-From the front panel go to the view , then select tools palette to control the coloring and so on .
2-From the function palette go to modern then select decoration, from there got many choices of choosing the shape that we want to use such as : thick lower box or lowered rounded box , flat circle , raised circle , ETC.
-Therefore, the using of not or gate computes the logical nor of the inputs as we can see at the signal once we run it .
No comments:
Post a Comment