Title of Activity
-Project progress
Using a table to display data .
Objectives
-Build the table to display data .
-Reduces the number of samples in the signal .
Content /Procedure
-In the following progress i have opened and added structures and express VIs to the block diagram to build a new VI. and i have build a VI that generates a signal , reduces the number of samples in the signal , and display the resulting data in a front panel table .
-In this exercise as well i have learned to open the context help window that display basic information about LabVIEW objects when you move the cursor over each objects.Objects will context help information include VIs. Function , structures and palettes, dialog box components, and so on.
-Displaying data in a table : the table indicator displays generated data. Use the build table Express VI to build a table of generated data of means values.

Figure 1 : block diagram to display data of the mean values

Figure 2 : front panel to display the data of the means value using table .
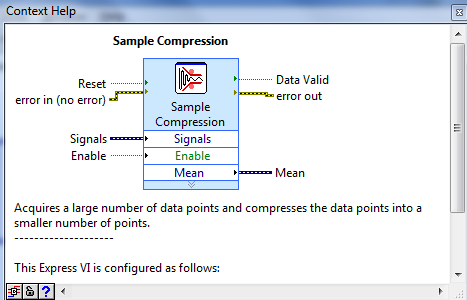
Figure 3 : Context help showing the description of sample Compression .
Result&Analysis
-From this exercise or progress of the final year project i could manage to display the values of means in a table by buiding the proper bock diagram and get the proper signal , means values from that signal .
-From this exercise or progress as well i learned if you want to get any explanation or function of any of the tools you just have to refer back to context help , context help provide you anything that you might need in the progress of dealing with LabVIEW and make it short term to understand the concept.
No comments:
Post a Comment