Tuesday, 19 March 2013

4 ~ 17 February 2013 (week 4 )


Title Of Activity

-Project Progress
 Using filtering to filter the signal .
 

Objectives

-The filter Express VI processes signals through filters and window. We use the filtering signal to remove the noise from a signal .

-Get to know what type of filter that am i going to use in the project , and what is the type of filters ?
-Compare and absorb the differences in both signal ( filtered , unfiltered ) . 

Content /Procedure 

-The types of filters are many such as Specifies the following types of filters to use: lowpass, highpass, bandpass, bandstop, or smoothing. The default is Lowpass.

-Filtering specification : Contains the following options:
  • Cutoff Frequency (Hz)—Specifies the cutoff frequency of the filter. This option is available only when you select Lowpass or Highpass from the Filtering Type pull-down menu. The default is 100.
  • Low cutoff frequency (Hz)—Specifies the low cutoff frequency of the filter. Low cutoff frequency (Hz) must be less than High cutoff frequency (Hz) and observe the Nyquist criterion. The default is 100. This option is available only when you select Bandpass or Bandstop from the Filtering Type pull-down menu.
  • High cutoff frequency (Hz)—Specifies the high cutoff frequency of the filter. High cutoff frequency (Hz) must be greater than Low cutoff frequency (Hz) and observe the Nyquist criterion. The default is 400. This option is available only when you select Bandpass or Bandstop from the Filtering Type pull-down menu.
  • Finite impulse response (FIR) filter—Creates an FIR filter, which depends only on the current and past inputs. Because the filter does not depend on past outputs, the impulse response decays to zero in a finite amount of time. Because FIR filters return a linear phase response, use FIR filters for applications that require linear phase responses.
  • Taps—Specifies the total number of FIR coefficients, which must be greater than zero. The default is 29. This option is available only when you select the Finite impulse response (FIR) filter option. Increasing the value of Taps causes the transition between the passband and the stopband to become steeper. However, as the value of Taps increases, the processing speed becomes slower.
  • Infinite impulse response (IIR) filter—Creates an IIR filter that is a digital filter with impulse responses that can theoretically be infinite in length or duration.
  • Topology—Determines the design type of the filter. You can create either a Butterworth, Chebyshev, Inverse Chebyshev, Elliptic, or Bessel filter design. This option is available only when you select the Infinite impulse response (IIR) filter option. The default is Butterworth.
  • Order—Order of the IIR filter, which must be greater than zero. This option is available only when you select the Infinite impulse response (IIR) filter option. The default is 3. Increasing the value of Order causes the transition between the passband and the stopband to become steeper. However, as the value of Order increases, the processing speed becomes slower, and the number of distorted points at the start of the signal increases.
  • Moving average—Yields forward-only (FIR) coefficients. This option is available only when you select Smoothing from the Filtering Type pull-down menu.
  • Rectangular—Specifies that all samples in the moving-average window are weighted equally in computing each smoothed output sample. This option is available only when you select Smoothing from the Filtering Type pull-down menu and the Moving average option.
  • Triangular—Specifies that the moving weighting window applied to the samples is triangular with the peak centered in the middle of the window, ramping down symmetrically on both sides of the center sample. This option is available only when you select Smoothing from the Filtering Type pull-down menu and the Moving average option.
  • Half-width of moving average—Specifies the half-width of the moving-average window in samples. The default is 1. For a half-width of moving average of M, the full width of the moving-average window is N = 1 + 2M samples. Therefore, the full width N is always an odd number of samples. This option is available only when you select Smoothing from the Filtering Type pull-down menu and the Moving average option.
  • Exponential—Yields first-order IIR coefficients. This option is available only when you select Smoothing from the Filtering Type pull-down menu.
  • Time constant of exponential average—Specifies the time constant of the exponential-weighting filter in seconds. The default is 0.001. This option is available only when you select Smoothing from the Filtering Type pull-down menu and the Exponential option.


                            Figure 1 : context help of filter .


                            Figure 2 : block diagram of filtering .

                              
                            Figure 3 : front panel of filtering .


 Result & Analysis 

-From the filtered signal  we can remove the noise from the signal .-Get to know the types of  filtered that i'm going to use which is low pass filter , Infinite impulse response (IIR) filter—Creates an IIR filter that is a digital filter with impulse responses that can theoretically be infinite in length or duration .


Monday, 18 March 2013

28~3 February 2013 (week 3)

Title of Activity 

-Project progress 
  Using a table to display data .

Objectives 

-Build the table to display data .
-Reduces the number of samples in the signal .


Content /Procedure 

-In the following progress i have opened and added structures and express VIs to the block diagram to build a new VI. and i have build a VI that generates a signal , reduces the number of samples in the signal , and display the resulting data in a front panel table .

-In this exercise as well i have learned to open the context help window that display basic information about LabVIEW objects when you move the cursor over each objects.Objects will context help information include VIs. Function , structures and palettes, dialog box components, and so on.

-Displaying data in a table : the table indicator displays generated data. Use the build table Express VI to build a table of generated data of means values.


                          Figure 1 : block diagram to display data of the mean values 


                           Figure 2 : front panel to display the data of the means value using table .


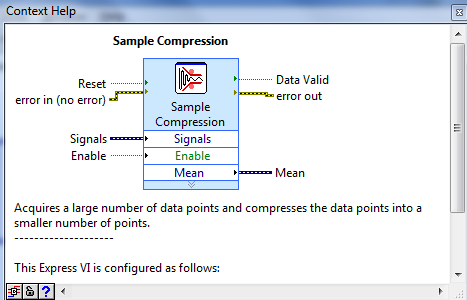
                            Figure 3 : Context help showing the description of sample Compression .


Result&Analysis 

-From this exercise or progress of the final year project i could manage to display the values of means in a table by buiding the proper bock diagram and get the proper signal , means values from that signal .

-From this exercise or progress as well i learned if you want to get any explanation or function of any of the tools you just have to refer back to context help , context help provide you anything that you might need in the progress of dealing with LabVIEW and make it short term to understand the concept.


Friday, 1 March 2013

Sunday, 27 January 2013

20 ~ 26 January 2013 (Week 2)

 Title of Activity

-Doing the exercise for getting started with LABVIEW in order to get the concept from the software chapter by chapter .

Objective: 

-To understand what is LABVIEW and what is the procedure for it .
-Analyse the signal of each part and construct the block diagram for it to get the signal .


 Content/Procedure:

-Acquiring a signal .
-Wile loop .
-Adding a knob to the front panel to control the amplitude .


-The front panel controls simulate the input on a physical instruments and supply data to the block diagram of the VI.Many physical instruments have knobs you can turn to change an input value .


-For the block diagram as shown below is showing the simulate signal wired up with wave graph to get the fully signal , by controlling by the knobs you can turn to change the input value and amplitude as well .


-the while loop , the terminal inside the loop are representation of front panel controls and indicators.Terminal are entry and exits ports that exchange information between the front panel and block diagram .


Result & Analysis

-As a result for this week to make sure that we can get the signal of acquiring signal through some of the controls such as knobs to turn the input value and the amplitude as well , and adding while loop to the block diagram .

-As analysis , to get the concept of building a virtual instruments .


Thursday, 21 February 2013

Friday, 18 January 2013

13~ 19 January 2013 (Week 1)


Title Of Activity 

-Meeting the supervisor 

Objective

- To know what is going to be done during this sem and what has been done during the holiday.
- To know the details of FYP2 and the procedure .

Content / Procedure

- Detail of the FYP2 and the procedure as well .


Conclusion

-I have shown my supervisor what has been done during the semester break and discuss about what is going to be done so far for this semester .


Thursday, 22 November 2012

10-16 October 2012 (week 13)


Tittle of Activity

-Project research-what is the blood volume

-make is as literature review.


Objectives 
-To know about the blood volume .


Content /Procedure

WHAT IS THE BLOOD VOLUME 


 Blood volume is a measurement of the volume, or amount of space, that the blood takes up in a given person. This includes both red blood cells and plasma, it is not limited to one particular part of blood. Maintaining a normal volume of blood is very important as it carries and essential nutrients throughout the body. If a person loses too much blood because of bleeding wound or because of inadequate blood cell synthesis, dangerously low blood pressure can result and may cause vital organs to receive inadequate amounts of oxygen and nutrients.


 There are many different factors that affect blood volume from person to person. Female, on average, have less blood than males do, and the bodies of children tend to contain less than those of grown men or women. Most people have roughly 102 gallons (407 litres) of blood in their bodies. Blood makes up approximately 1/11 of human body weight. People who live at high altitudes tend to have a higher volume because there is less oxygen in the air, the extra blood is needed to carry additional oxygen 
.throughout the body


Blood volume is regulated by the excretory system, particularly by the action of the kidneys. When the amount of blood in the body increases to a certain point, blood pressure increase and, through mechanism involving nerves and hormones, a signal is sent to the kidneys. The kidneys then reabsorb less fluid, causing more water and other substances necessary to blood production to be lost through urination, decreasing the volume of blood. The opposite happens when there is too little blood, the kidneys reabsorb more water and other substances necessary for blood, causing less to be lost through urination. Through this and other mechanism, blood pressure and volume are regulated and maintained at healthy levels


The volume of blood in a pregnant woman increases drastically over the normal amount of blood in the body, and it can actually increase by 25 to 50% because the developing fetus and the women is enlarged reproductive organs both needs more blood. To supply this blood, the heart must beat harder and faster tan usua and some blood vessel grow larger. In most cases, the volume of the plasma component of blood increases more than the volume of red blood vessel cells. This can lead to cases of 
anemia in pregnant woman, which tends to cause dizziness and fatigue.

 
Result &analysis 

 . To get the knowledge about blood volume with 
.To know the volume of blood in pregnant women  


Monday, 12 November 2012

9 ~ 15 October 2012 (Week 12)


Title of Activity

-Discussing with the supervisor about proposal and submition of proposal ,however.Discuss about the report and the three chapter in details.


Objective

-Get to know the due date of submition.

-To know the detail of the report .


Content - Procedure

-Detail of the report and first 3 chapter 

3 CHAPTERS :
FIRST CHAPTER :
-Project introduction & Report description.

SECOND CHAPTER:
-Literature review .

THIRD CHAPTER:
-Project methodology .


Result & Analysis

-I will use and improvise these three chapters for my final report as well .


Wednesday, 7 November 2012

8 ~ 14 October 2012 (Week 11)

Title of Activity

-Project research - the PPG waveform .
-Make it as literature review.


Objective

-To know about the PPG waveform .


Content / Procedure

Surf the internet for some information about PPG waveform .


Measurement system 


           A schematic diagram of the equipment used is shown in Figure 1. For photoplethysmographic (PPG) measurements the finger clip sensor (Nellcor Durasensor analog) was used (Fig. 1, block 1). The special laboratory instrument for PPG signal amplifying was designed (block 2). The scheme contains two Light Emitting Diodes (LED): red and infrared. The current in LEDs is limited by consistently connected resistor 150 ohm. Both LEDs are multiplexed on two contacts of the sensor. 

By changing polarity of a current it is possible to switch LED s  but  it is impossible to run both simultaneously. A special National Instruments data acquisition board (DAQ) PCI-MIO-16E-1 (block 3) to digitize the signals locally and transmit the digital data to the personal computer with sampling rate 500Signals from finger sensor are amplified by the PPG signal amplifier and then the signal is directed to the DAQ board where acquisition and analog-to-digital conversion take place. Once data is acquired and received it is possible to process and manipulate it. The LabVIEW software packet (block 4) consists of the following programs: main program for data acquisition; program for signal analysis; program for calculations.  


The waveform analysis was performed to assess the PPG characteristics. The waveforms were analyzed offline using LabVIEW programs. The computer program displayed the incoming waveform  on the screen of the computer. The minimum and maximum threshold (further P1 and P2) and valley (V) values were used as marks for signal analysis and comparison.  To locate necessary points of signal five markers were used.  Marker 1 characterizes the location of the first foot of the pulse. Marker 2 characterizes the location of the first peak. Marker 3 characterizes thelocation of the second peak. Marker 4 characterizes the location of the valley.  Marker 5 characterizes the location of the 
second foot (Figure 2).  


Result & Analysis

-Get the knowledge of PPG waveform .
-To know the PPG pulse recognition.